Simulation of airflow pattern in clean space
In fields such as electronic factories, clean rooms, data centers, and biomedical facilities, clean spaces are key facilities. These factories need to maintain specific cleanliness levels as well as temperature and humidity conditions to ensure product quality and the smooth progress of the technological processes. And the form of air distribution within the rooms is an important factor that affects room cleanliness, the number of suspended particles, the uniformity of temperature and humidity, pressure differences, and air conditioning energy consumption. To achieve this goal, it is crucial to conduct finite element simulation analysis on air distribution schemes using CFD air flow simulation software during the design stage or the construction detailed design guidance stage, in order to understand the air flow distribution and the transmission mechanism of pollutants. This provides valuable insights for design, optimization, and management.

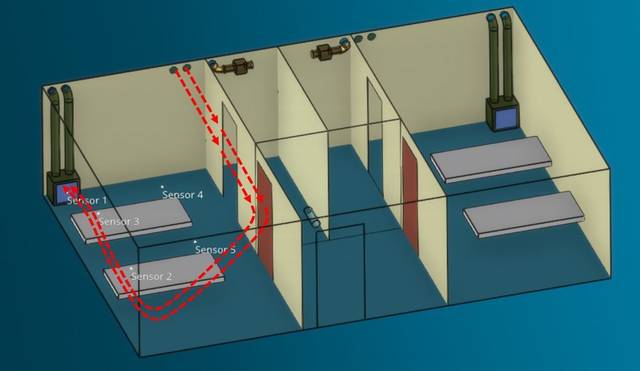
Case of Air Distribution Simulation:
Design of Ventilation System in Hospital Wards - Analysis of Air Distribution and Pollution Source Diffusion
The air supply and exhaust systems in hospitals are of great importance for infectious disease hospitals. In order to effectively avoid cross-infection caused by air flow and pollutant discharge, when designing the air supply and exhaust systems, comprehensive design and on-site conditions are used to set boundary conditions. Dassault Systèmes' leading XFLOW software is applied to simulate and analyze the transient distribution of air flow and pollutants in the wards, and based on the XFLOW tool, the relationship between the pollutant concentration at the positions of patients and medical staff and the air distribution is calculated.
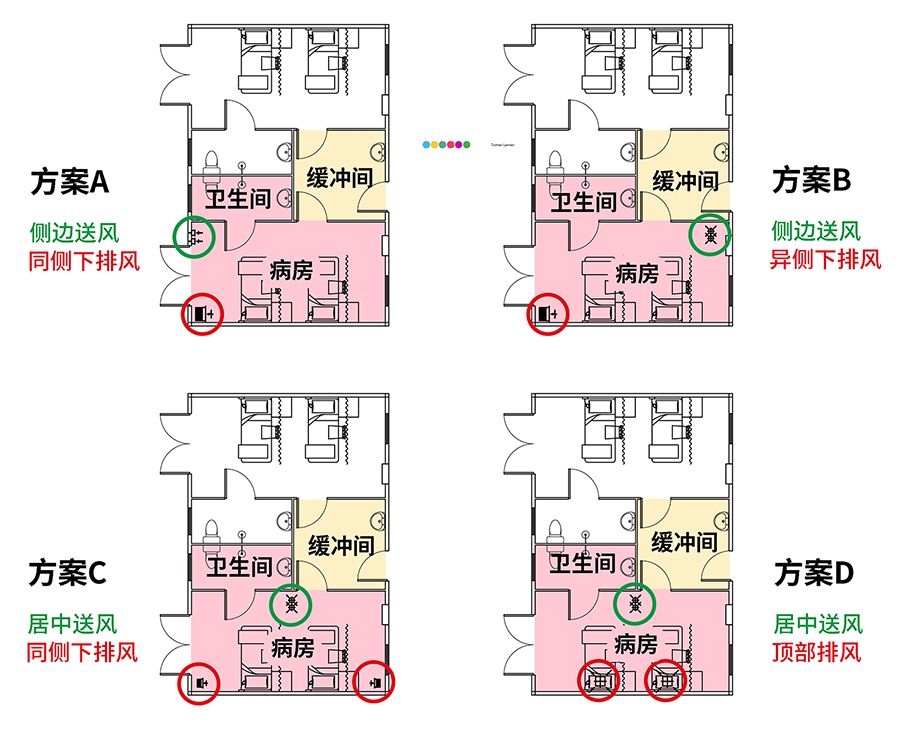
Air Distribution Scheme
Combining the characteristics of on-site implementation, we discussed and formulated four air distribution schemes for transient XFLOW simulation calculations.
Among them, Scheme A is side air supply and same-side air exhaust.
Scheme B is side-top air supply and opposite-side air exhaust.
Scheme C is central air supply and two-side air exhaust.
Scheme D is central air supply and top air exhaust.
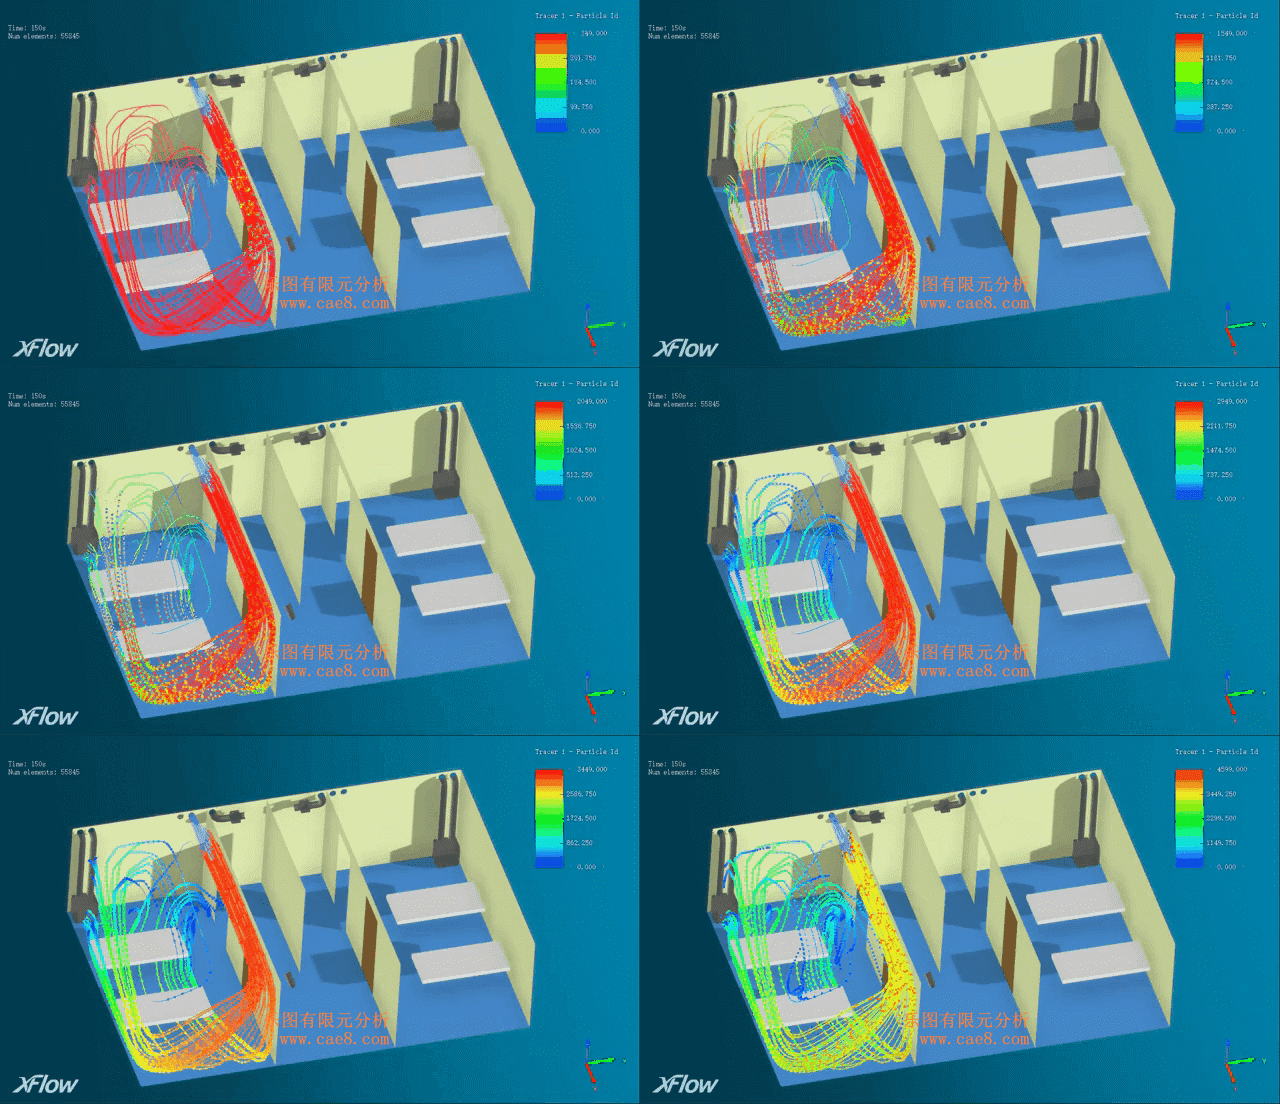
Analysis Results - Streamlines of Air Distribution Analysis (Optimal Scheme A)
After comparing the effects of the four schemes, we found that Scheme A forms a "U" -shaped ventilation environment inside the ward. The air flow flows out from the air supply duct, changes direction after hitting the opposite wall, and finally passes through the two patients and reaches the lower return area, and is then discharged after being filtered by the exhaust outlet. Only the cloud chart of Scheme A is shown here.
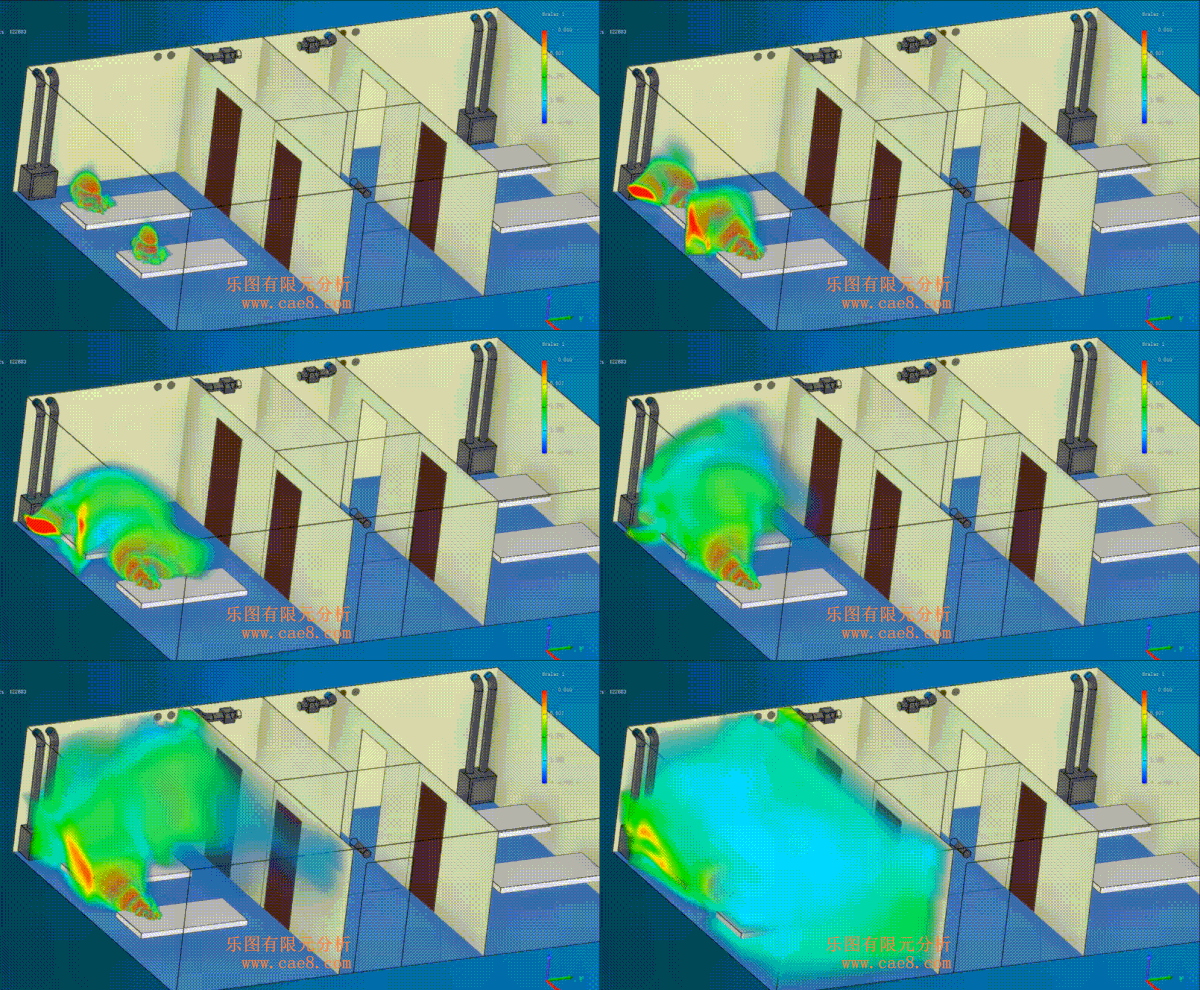
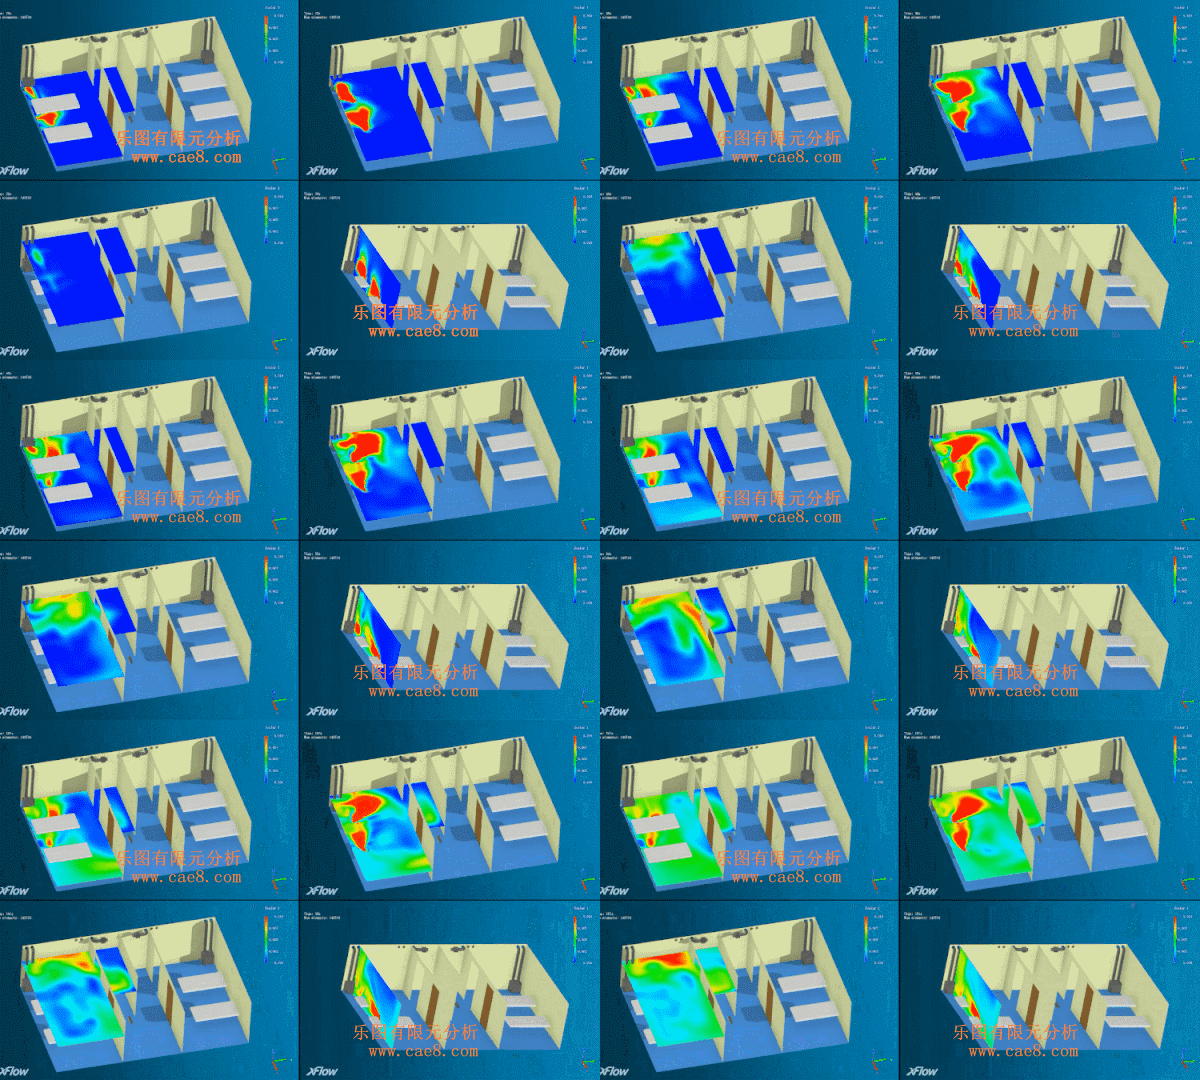
Analysis Results of Air Distribution - Pollutant Diffusion Process (Optimal Scheme A)
Under the layout of Scheme A, the "U" -shaped ventilation environment can effectively send the pollutants exhaled by patients to the exhaust outlet. The transient animation calculated by XFLOW simulation shows the diffusion process of pollutants in the room.
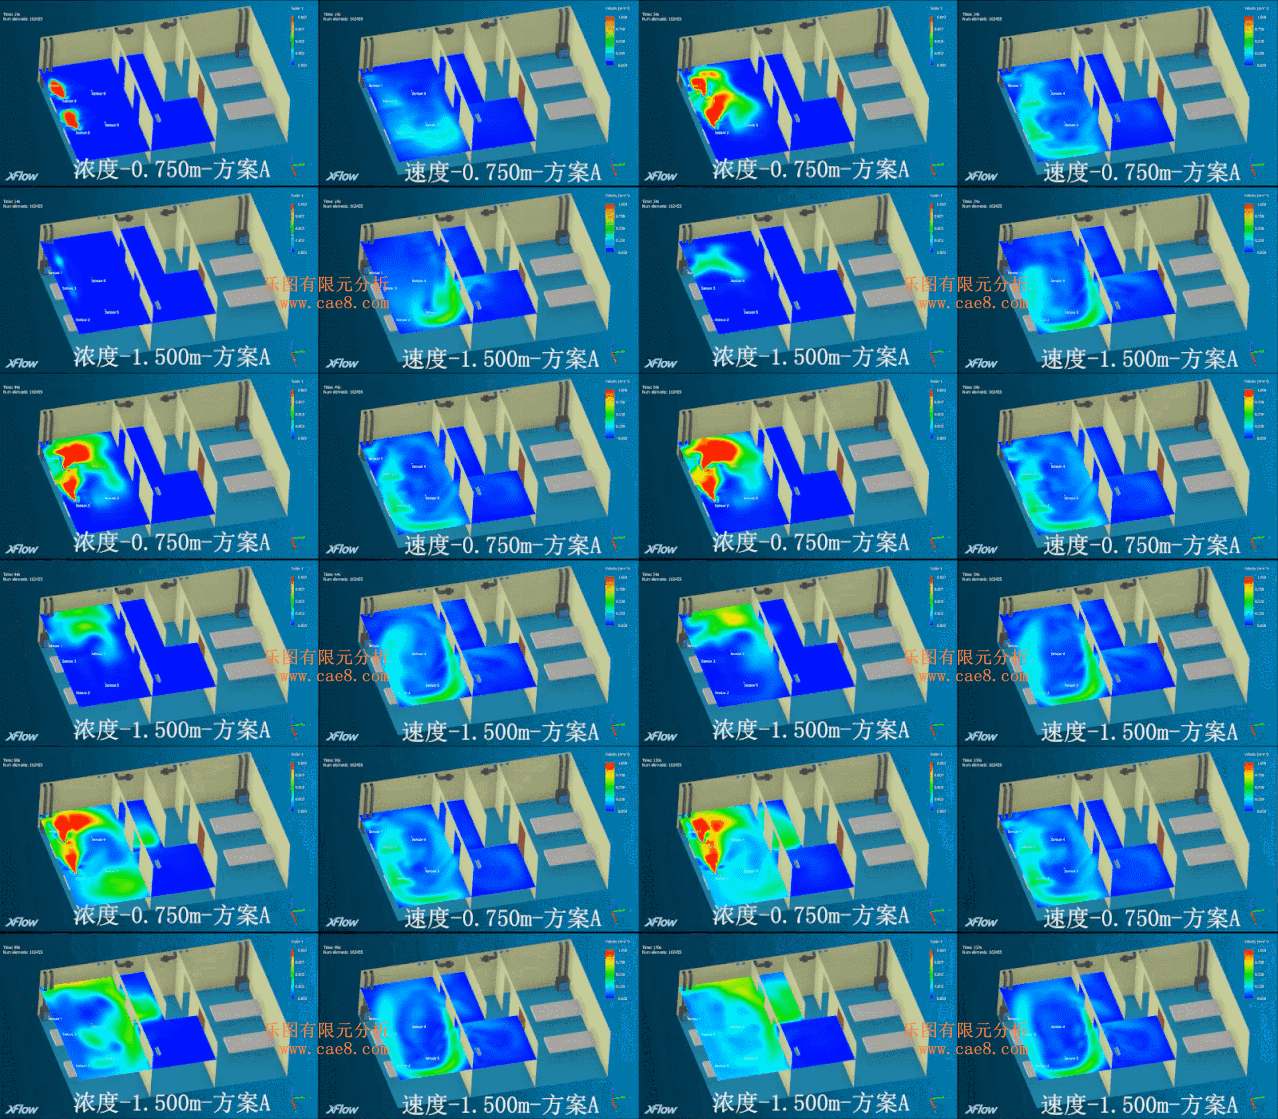
Analysis Results of Air Distribution - Indoor Pollutant Concentration Distribution (Optimal Scheme A)
After calculation and statistics on the transient change rules of pollutant concentrations, the analysis results of pollutant concentrations at the positions of patients and doctors at a certain transient moment under different HVAC layouts are shown in the figure below. Among Schemes A/B/C/D, Scheme A is the best. Only the cloud charts of each height plane in Scheme A are shown here.
Analysis Results of Air Distribution - Pollutant Concentrations and Velocity Field (Optimal Scheme A)
Under the air distribution of Scheme A, the pressure difference between the buffer room and the ward can effectively prevent pollutants from diffusing into the buffer room.
Summary of Air Distribution Simulation
Based on the above analysis of air distribution, we can draw the following conclusions:
1. Under the design conditions, among the four air distribution schemes, the effect of same-side air supply and exhaust is the best.
2. The distribution of pollutant concentrations and the air flow velocity field in the ward are not consistent. When designing, the distribution of pollutant concentrations and the direction of air flow should also be considered.
3. The concentration in the triangular area below the air supply outlet in the ward is relatively high. It is recommended that medical staff stay away from this area as much as possible.

Leto Intelligent Manufacturing Technology (Suzhou) Co., LTD
199 4191 2022
Business consulting/technical consulting/exchange advice
Scan code wechat consultation, 24 hours to look forward to your voice

